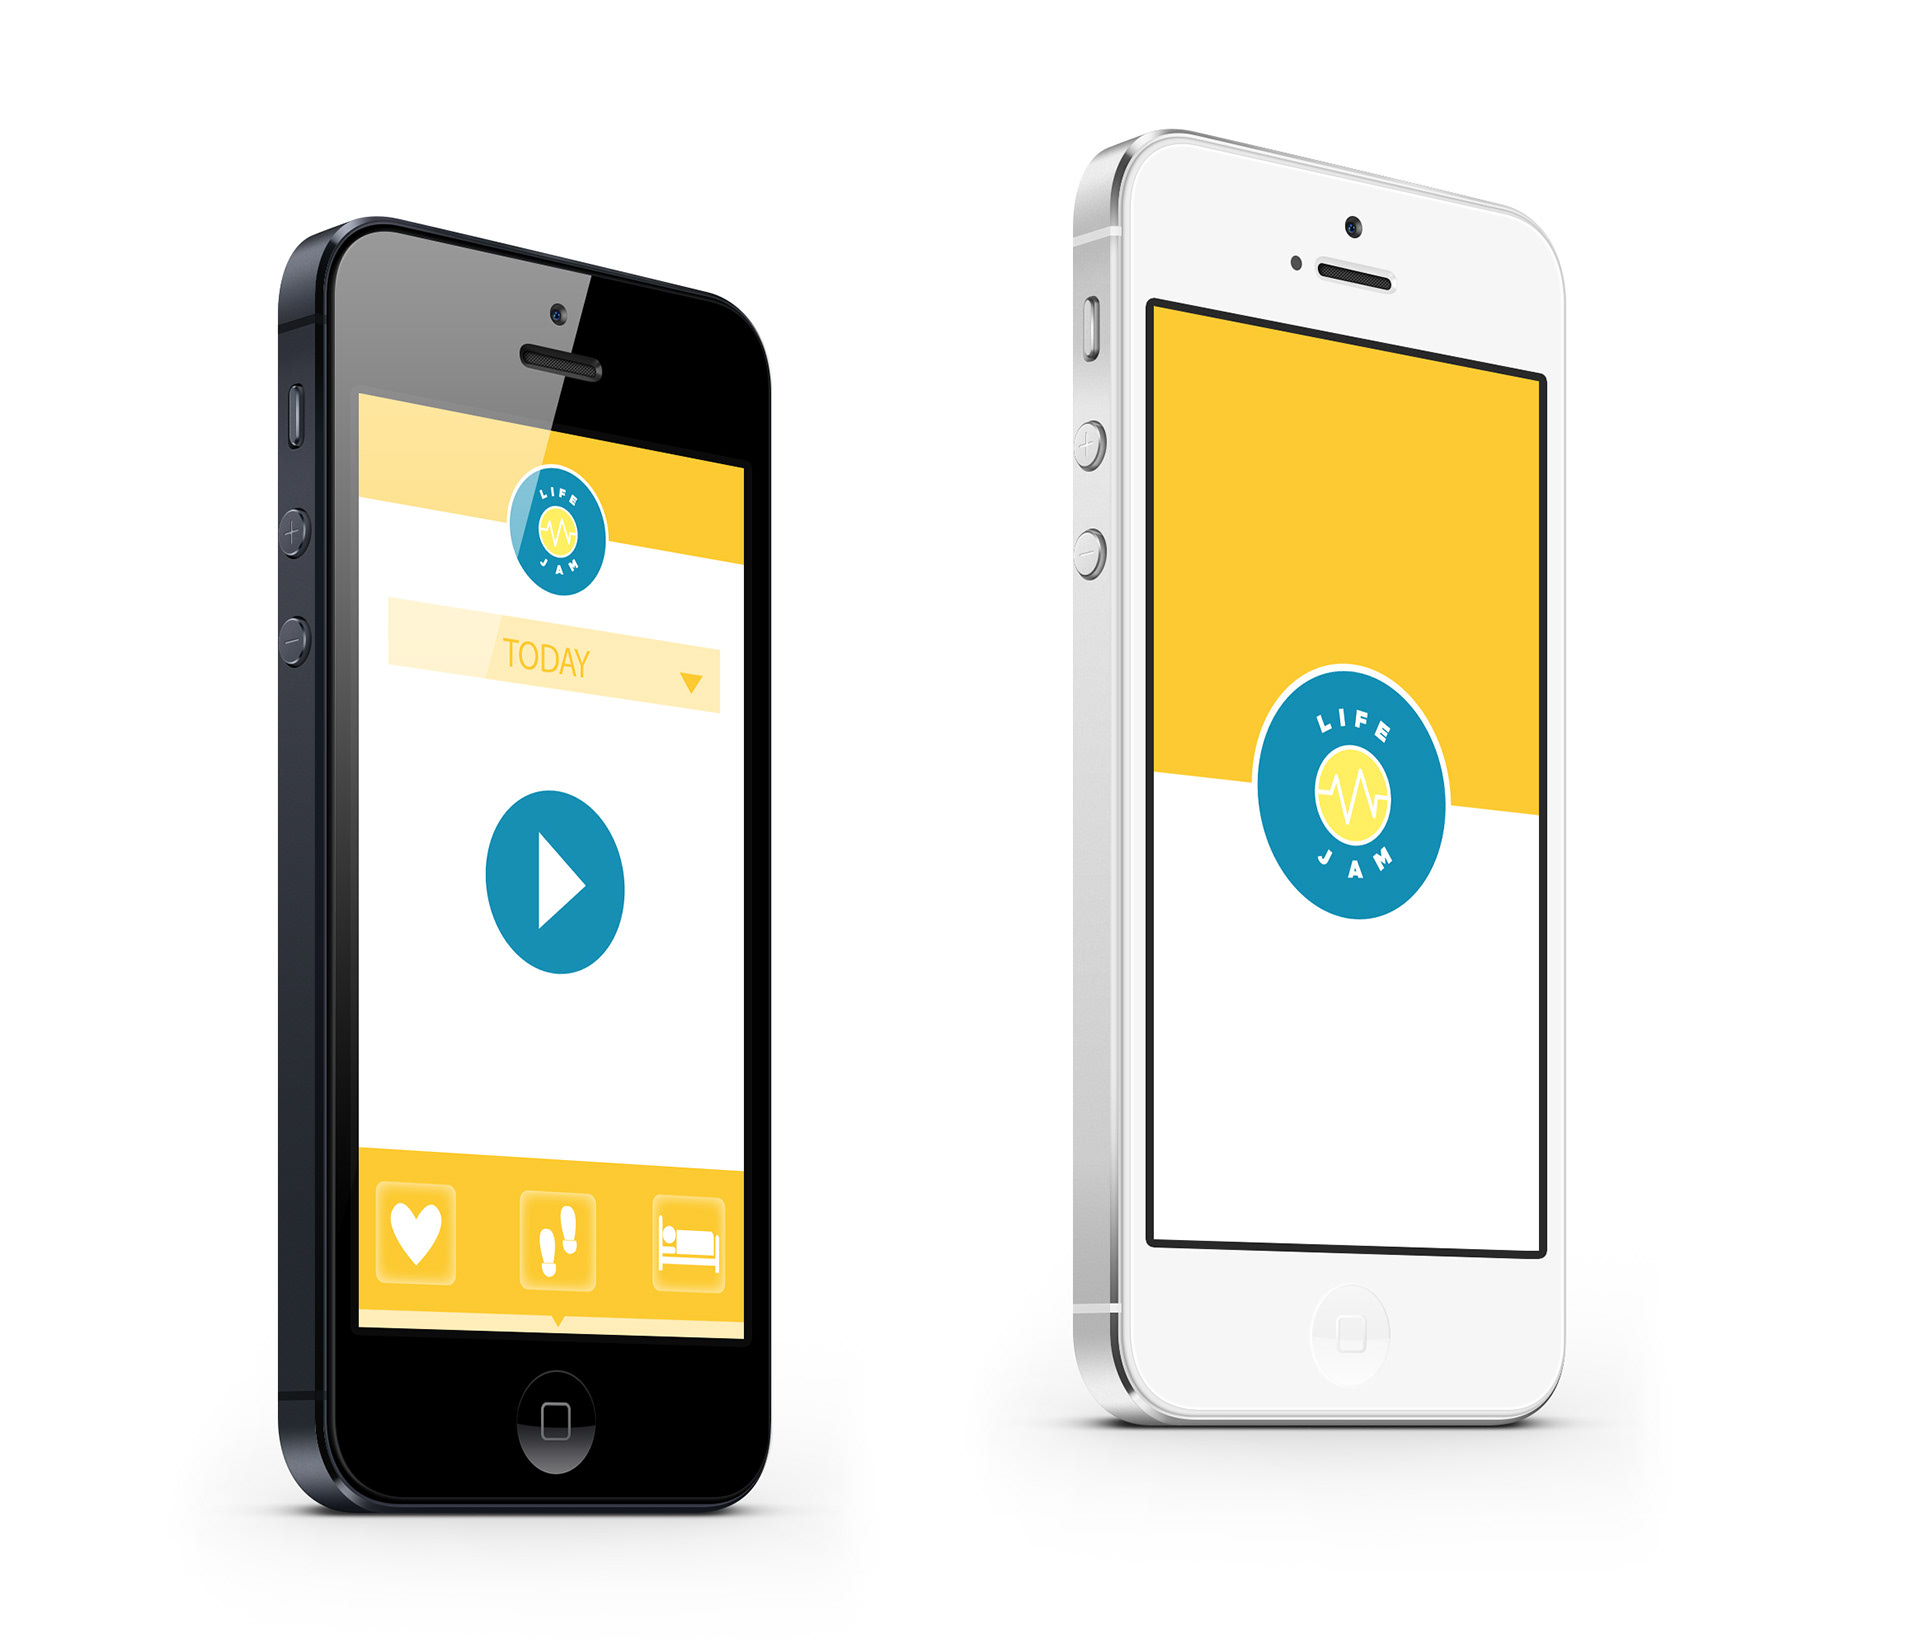
The main screen shows buttons that you can press to listen to your data for each icon. The heart represents heart beat, the feet are the number of steps you've taken and the bed is the hours of sleep you've had. You can either click on the icons to hear the sound of your health, or scroll up to see the exact data points.
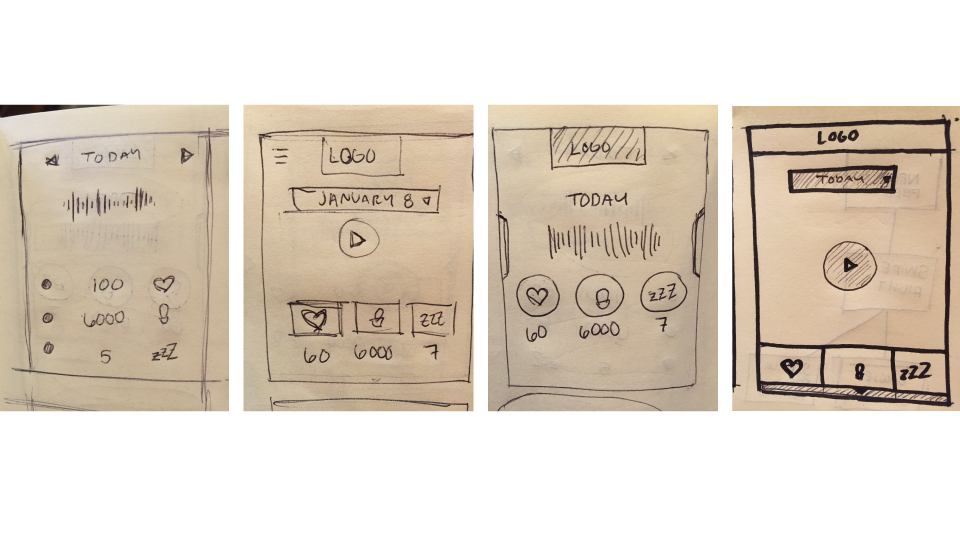
Here is the progression of wireframe sketches.
This is the sound of someone who is unhealthy. Their song is off key and their sound waves are the color red. This gives a visual and a sonified representation of their health data for the day.
This is the sound of someone who is healthy. Their song is on key and their sound waves are the color green. The tab below is also lifted so that the user can see their exact data points.